Tuesday, December 15, 2020

WTO Membership Anaylsis

Finland has been a member of the World Trade Organization (WTO) since its formation in 1995.

There are many advantages of Finland being a member country of the WTO as well as a couple of disadvantages.

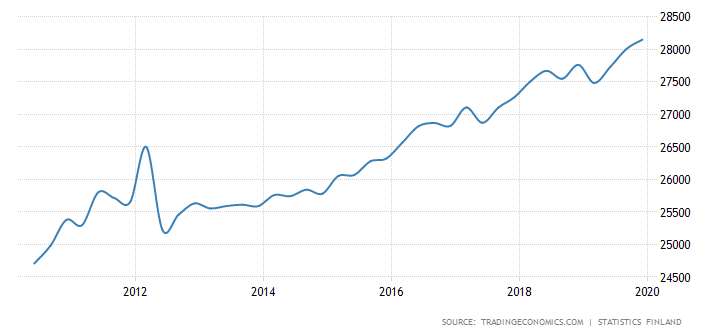
Global trade is a big driver of the Finland economy, as of 2017, about twenty-eight percent of Finland’s total employment was linked to their export industries. This means that being a part of the WTO allows Finland to grow its economy through global trade with little to no barriers. In the past several years, Finland has seen more domestic employment within these export industries as they are able to trade more and more on the global market.

Another advantage of being a member of the WTO are the lowered tariffs. The WTO prides itself on being able to lower tariffs on a global scale, and this proves advantageous for Finland. As other countries have low tariffs for imports and since Finland is a big exporting country, Finland is able to export more goods and services because the cost is reduced. This also leads to more world efficiency.

Finland also benefits from the openness of trade negotiations that the WTO promotes. A few years ago, several member countries of the Wto, including Finland, came together on an agreement to eliminate tariffs on new generation information technology products. The trade of these products is worth over one trillion dollars every year. This boosts the Finland economy as it leads to domestic growth in tech industries.

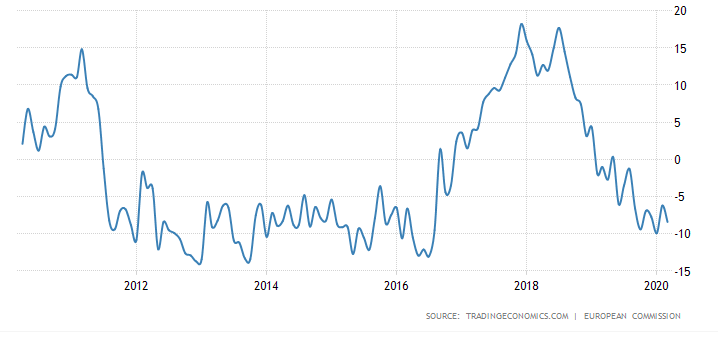
A disadvantage of being a member country includes a heavy dependency on the trade agreements of the WTO. During or after any kind of global depression, such as after the Financial Crisis, there is more global distrust in global trade and multilateralism which harms the Finland economy because a large portion of their economy is based on exports through the WTO. During times of crisis when countries tend to implement more protectionist policies to protect their own country and domestic industries--which hurt exporting industries such as Finland.

Another possible disadvantage is pressure, for non-developing countries such as Finland to spend money on other poorer countries in the WTO

Sources:

Monday, October 12, 2020

Causes of Poverty and Inequality

When it comes to homelessness, Finland is doing well in supporting its homeless population as homelessness is on the decline, however, it wasn’t always like this (Glösel). There are two main factors that contributed to homelessness and poverty in Finland.

One of the primary reasons for poverty and homelessness in Finland is the expensive housing (Thelwell). There is slow growth in the housing industry and with a shortage of housing, prices have risen dramatically. In addition to that, there is not much competition in the housing market to drive down prices, so prices remain relatively stable but high (Bank of Finland). The shortage of affordable housing contributes to poverty and homelessness as low-income people may not be able to afford the rising housing prices and the homeless are not able to afford to purchase housing.

Another factor that contributed to homelessness in Finland was the vicious cycle of homelessness that homeless people were trapped in. Without a housing address, a homeless person could not apply for any jobs; without a job, the homeless person could not apply for any housing. This was a vicious cycle that kept homeless people on the streets. Luckily, Finland has addressed this issue and provided more resources for their homeless population with, for example, the “Housing First” policy (Glösel).

Looking at income inequality in Finland between the 1990s and 2010, we see it is on the rise. The income distribution shifted to the high-income groups as their income increased- mainly through capital income. The highest income group had increased their financial assets thus increasing their wealth through capital income. This also caused a higher net wealth inequality as the high-income groups continued to increase their net wealth through attaining more capital and capital income (Blomgren).

Works Cited

Bank of Finland. “Rise in Services Prices Has Made Finland an Expensive Country.” Bank of Finland Bulletin, Bank of Finland, 30 June 2015, www.bofbulletin.fi/en/2015/3/rise-in-services-prices-has-made-finland-an-expensive-country/.

Blomgren, Jenni, et al. “Growing Inequalities and Their Impacts in Finland.” GINI Growing Inequlaities' Impacts, Nov. 2012.

Glösel, Kathrin. “Finland Ends Homelessness and Provides Shelter for All in Need.” Pressenza, 13 July 2020, www.pressenza.com/2020/07/finland-ends-homelessness-and-provides-shelter-for-all-in-need/.

Thelwell, Kim. “Top 10 Facts About Poverty in Finland: Issues & Solutions.” The Borgen Project, Kim Thelwell Https://Borgenproject.org/Wp-Content/Uploads/The_Borgen_Project_Logo_small.Jpg, 17 Dec. 2019, borgenproject.org/top-10-facts-about-poverty-in-finland/. 

Tuesday, October 6, 2020

Inequality and Poverty

2006 Gini Index: 28
2016 Gini Index: 27.1   

    Above is a Lorenz curve for Finland that reflects the distribution of income within the economy. The blue line represents perfect equality, where 20% of the population earns 20% of the income and 40% of the population earns 40% of the income, and so on and so forth. The red line represents Finland's distribution of income in 2016 and the orange line represents Finland's distribution of income in 2006. As you can see, both curves are below the perfect equality line meaning that Finland has an unequal distribution of income. The further the curve is away from the line of perfect equality, the more unequal the distribution of income is. As you can see, the 2016 red line is above the orange 2006 line and is closer to the line of perfect equality; this means that in 2016, Finland had a better distribution of income than in 2006. 
    Another factor we can look at to compare inequality of income distribution is the Gini index. The lower the Gini index number, the less income inequality the country has. In 2006, Finland's Gini Index was 28 on a scale of 100, which is already relatively low compared to other countries around the world. Then we can see that in 2016, the Gini index fell to 27.1 which means that there was less income inequality in 2016 than in 2006. We came to this conclusion also by using the Lorenz curve, so using the Gini index is just another way to look at income inequality within a country and compare it over time or to other countries. So far, from the data, Finland is heading in the right direction and becoming more equal in income distribution!
    

Tuesday, March 31, 2020

Aggregate Demand

Here are graphs of indicators of the aggregate demand of Finland.

Consumer Spending (Unit- EUR Million)


Business Confidence (Points)


Government Spending (Unit- EUR Million)


Balance of Trade (Unit- EUR Million)


From these charts, we can see that consumer spending has increased over the past 10 years, business confidence has been declining for the past couple of years, government spending looks to be slowly increasing, and the balance of trade seems to be relatively at the same level. The increased consumer spending and government spending indicates a growing aggregate demand however, the reduced business confidence brings down the aggregate demand. All of these indicators besides business confidence suggests an increasing aggregate demand over the last 10 years. Interestingly, there is a spike in consumer spending and business confidence around the year 2012.

Looking at a chart showing the changing GDP growth, the graph actually looks most similar to the business confidence chart. There is a spike in growth in 2010 - similar to the spike in business confidence. Then, GDP growth falls after 2010 and rises only a little just to begin a downwards slope in 2017. It might be that the GDP growth can be an indicator of future aggregate demand. If this is the case, then Finland should supposedly see a drop in AD in the future- that is if the GDP growth continues to fall. Thinking about it another way, overall, Finland’s GDP growth has been increasing since 2009, just like most of the indicators of AD, so in this sense, AD and GDP growth seem to be working hand-in-hand (this could be a stretch though depending on how you view the indicators and GDP growth).

Friday, March 27, 2020

The Level of Overall Economic Activity

Here is a table showing the GDP data of Finland. Below are graphs containing other data related to Finland's economy.


Year
GDP (USD Billion)
GDP Per Capita (USD)
GDP Growth/year
2018
276.743
50,152.34
1.671%
2017
254.435
46,191.931
3.051%
2016
240.57
43,777.44
2.628%
2015
234.585
42,811.213
0.561%
2014
274.497
50,260.3
-0.365%
2013
271.285
49,878.043
-0.902%
2012
258.305
47,710.79
-1.397%
2011
275.244
51,081.998
2.548%
2010
249.181
46,459.973
3.186%
2009
252.479
47,293.993
-8.075% 


Based off of these graphs, I believe that Finland is in a slow expansion phase. The unemployment rate shows to be slowly decreasing which can indicate a growing economy. Since more people are being employed, people have more money and are able to spend some of that money thus, boosting the economy. The inflation rate seems to have jumped up from 2015 which, in moderation, can be good for the economy. It can be a sign that people are spending more money because as spending increases, inflation is bound to increase as well. The data for Finland's current account balance is relatively volatile, however, the negative percentage can indicate that as their economy is slowly expanding and employment rises and spending rises, the country is borrowing or importing a lot of goods and services. In a growing economy, it is common for the goods and services to be imported and the percentage of this happening increased from 2017 to 2018. Data concerning Finland's GDP shows a slow growth starting in 2015 and then slowing in 2018, but still growing. All of this information leads me to believe that Finland may be in a slow recovery or expansion.