Tuesday, March 31, 2020

Aggregate Demand

Here are graphs of indicators of the aggregate demand of Finland.

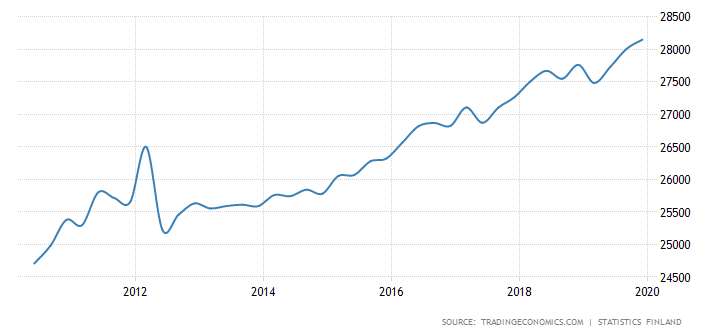
Consumer Spending (Unit- EUR Million)


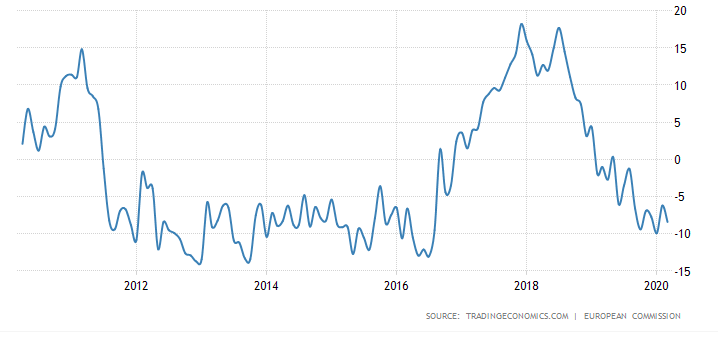
Business Confidence (Points)


Government Spending (Unit- EUR Million)


Balance of Trade (Unit- EUR Million)


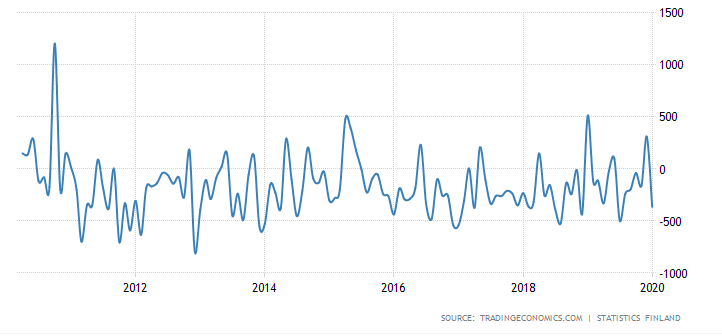
From these charts, we can see that consumer spending has increased over the past 10 years, business confidence has been declining for the past couple of years, government spending looks to be slowly increasing, and the balance of trade seems to be relatively at the same level. The increased consumer spending and government spending indicates a growing aggregate demand however, the reduced business confidence brings down the aggregate demand. All of these indicators besides business confidence suggests an increasing aggregate demand over the last 10 years. Interestingly, there is a spike in consumer spending and business confidence around the year 2012.

Looking at a chart showing the changing GDP growth, the graph actually looks most similar to the business confidence chart. There is a spike in growth in 2010 - similar to the spike in business confidence. Then, GDP growth falls after 2010 and rises only a little just to begin a downwards slope in 2017. It might be that the GDP growth can be an indicator of future aggregate demand. If this is the case, then Finland should supposedly see a drop in AD in the future- that is if the GDP growth continues to fall. Thinking about it another way, overall, Finland’s GDP growth has been increasing since 2009, just like most of the indicators of AD, so in this sense, AD and GDP growth seem to be working hand-in-hand (this could be a stretch though depending on how you view the indicators and GDP growth).

Friday, March 27, 2020

The Level of Overall Economic Activity

Here is a table showing the GDP data of Finland. Below are graphs containing other data related to Finland's economy.


Year
GDP (USD Billion)
GDP Per Capita (USD)
GDP Growth/year
2018
276.743
50,152.34
1.671%
2017
254.435
46,191.931
3.051%
2016
240.57
43,777.44
2.628%
2015
234.585
42,811.213
0.561%
2014
274.497
50,260.3
-0.365%
2013
271.285
49,878.043
-0.902%
2012
258.305
47,710.79
-1.397%
2011
275.244
51,081.998
2.548%
2010
249.181
46,459.973
3.186%
2009
252.479
47,293.993
-8.075% 


Based off of these graphs, I believe that Finland is in a slow expansion phase. The unemployment rate shows to be slowly decreasing which can indicate a growing economy. Since more people are being employed, people have more money and are able to spend some of that money thus, boosting the economy. The inflation rate seems to have jumped up from 2015 which, in moderation, can be good for the economy. It can be a sign that people are spending more money because as spending increases, inflation is bound to increase as well. The data for Finland's current account balance is relatively volatile, however, the negative percentage can indicate that as their economy is slowly expanding and employment rises and spending rises, the country is borrowing or importing a lot of goods and services. In a growing economy, it is common for the goods and services to be imported and the percentage of this happening increased from 2017 to 2018. Data concerning Finland's GDP shows a slow growth starting in 2015 and then slowing in 2018, but still growing. All of this information leads me to believe that Finland may be in a slow recovery or expansion.